
I been performance tuning an OLTP system which is built with Visual Basic Front end, Microsoft Components middle tier and SQL Server back-end for DBMS. It uses stored procedures for all its work relating to database. This makes it easier for me to tune most of the issues in the system because the front end code doesn’t have to be re-written and deployed.
So anyhow this system was having serious performance issues for many reasons (most of them being worked on still). But today here I am going to talk about two issues in particular 1) Parameter Sniffing 2) Max Clause without/ Group By.
1) Parameter Sniffing
This is not a new topic, but since most of the systems I support as a DBA don’t involve stored procedures I don’t run into this much.
“Parameter Sniffing” refers to a process where by SQL Server’s execution environment “sniffs” the current parameter values during compilation or recompilation, and passes it along to the query optimizer so that they can be used to generate potentially faster query execution plans. The word “current” refers to the parameter values present in the statement call that caused a compilation or recompilation. [1].
Omnibuzz [1], talks about simple way into fix this issue. I want to just talk about how to figure out if this issue exists in your data or if are being inflicted by this.
When SQL Server is generating execution plans it relies on Indexes & Statistics to tell it how it should access data. These plans stay in memory until SQL Server cannot hold them any more or the plans have expired forcing a recompile [2]. When SQL Server is building a plan for a stored procedure it is basing its decisions on the question asked but if that question changes every time then execution plan might not be optimal for next question as it was for the first question. One of the reasons for this can be missing statistics on data generating less then optimal execution plan, another reason is the data in table(s) being affected is distributed like a bell curve [3].
How I noticed I had issue with this particular stored procedure?
- I was recording execution plans from production and doing testing on another SQL Server.
- Both databases were same, test had been restored from production.
- The indexes and statistics were all up-to-date on both systems (i.e. there was no fragmentation and they were not out-dated; this does not exclude the fact that there might be missing indexes/statistics).
- When stored procedure executed on production system it generated 22 million reads and took about 220s to execute and returns 2 rows (eww? right!) [Plan A].
- When I executed the same stored procedure on test server, it generated about 50K reads and took about 20s to execute and returns 2 rows also (what the!?!) [Plan B].
So at first parameter sniffing didn’t come to my mind; I first looked at the execution plans on both servers, they looked almost identically. But there were few key differences that caused [Plan A] to cause full table scans of 2 more tables, because the plan that had been generated was for large data set. Where as [Plan B] was generated was for 2 rows only. Microsoft SQL Server decides a difference between a Scan and Seek on a index based on number of being selected and its about 0.3% of the rows [4]. So now I was thinking this was parameter sniffing; so I made the stored procedure use a generalized plan. Generalized plans work great for 70% of the queries, as the extreme data is selected from either end of the bell curve the performance degrades a bit.
After generalizing I was expecting the performance to be better and as expected it did go down from 22 million reads to about 150K reads. But considering it was returning 2 rows, this was still not a good enough answer. But at least it was same execution plan every time, so it is possible to tune this now. I turned my attention to possible missing indexes and the SQL code in stored procedure. I couldn’t really see any missing indexes, so still running a bit confused; looking at execution plan and the stored procedure I found still few full table scans. This lead to me finding following code, which was causing the SQL Server to generate full table scans.
2) Sub-select issues
SELECT *
  FROM SampleTable ST
WHERE DTValue = (SELECT MAX(DTValue)
                    FROM SampleTable
                   WHERE SampleTable.ID = ST.ID)
   AND MainID = 98
Note: SampleTable has 3 columns, MainID, ID, and DTValue; with 1 million rows. I generated the data using Red Gate Data Generator so I don’t have script sorry.
This looked like fairly simple code; but it generated following execution plan:

Problem with this execution plan is it generates a full scan but why? We are passing in the ID value so it should only need to select subset of the data. Problem is the sub-select being used to complete the max date for given ID has no Group-By clause and the sub-select doesn’t know anything about the MainID. So execution plan does the following to return us the result set:
- Get list of all ID and Dates pairs from the Clustered Index, returning full 1 million rows (note it is ignoring MainID, has no idea which ID value links to which MainID).
- Compute Max Date for each ID value generated from step 1; returning ID and Max(DTValue) pairs, returning 159 rows (again this is completely invalid data; as the rows returned *might* not be for MainID that was passed in).
- Next seek the MainID index based on our ID value we passed, getting pair of ID and DTValues for given ID, returning 635 rows.
- Then last but not least match results from step 2 and step 3 to produce final output of 0 row (because the rows returned from step 2 are all invalid).
So problems with this?
- Its missing the filter clause causes system to return invalid data.
- Missing group-by clause makes it so SQL Server does grouping before filtering the data.
I rewrote the SQL to following:
SELECT *
  FROM SampleTable ST
 WHERE DTValue = (SELECT MAX(DTValue)
                    FROM SampleTable
                   WHERE SampleTable.ID = ST.ID
                     AND SampleTable.MainID = ST.MainID
                GROUP BY ID)
   AND MainID = 786
This time it generates following execution plan:
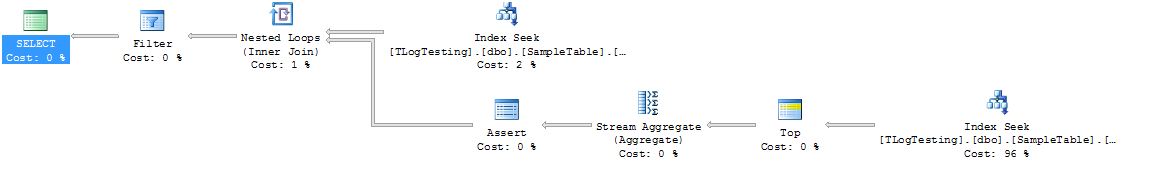
This execution plan is bigger then the previous one; but lets look at the differences.
- Index Seek for MainID, returning Triplet of MainID, ID, and DTValue for given MainID; returning 635 rows (top row).
- Index Seek based on MainID and ID, returning Triplet of MainID, ID, and DTValue for given MainID and ID. (bottom row, steps 2-4 repeated for each row in Step 1.).
- Followed by TOP, which is looking at the top DTValue..
- Following by the Stream Aggregate like before to compute the Max(DTValue).
- Assert, checking to make sure some rows were returned.
- After it finished computing Max(DTValue) for each MainID & ID Pair it filters data based on Max(DTValue) found.
This time it had to do more work to get the final result; but there are few key differences:
- No full table scan on 1M row table. It did quick seeks 635 times, which at most would have caused about 3 reads; so total of 1905 reads; comparing to before which it caused 4435 reads. So we have gained an improvement of about 232%!. Imagine the affect on table with 10 million, 100 million or more rows.
- We are now actually getting some results back, comparing to before of zero. So this is actually corrects a mistake in query also.
References
[1] Parameter Sniffing & Stored Procedure Execution Plan. SQL Garbage Collector. Omnibuzz. Link.
[2] Execution Plan Cache and Reuse. Books Online. Microsoft. Link.
[3] Bell Curve. Wikipedia. Link.
[4] Seek or Scan?. Microsoft SQL Server MVP, Gail Shaw. Link.
[5] Dissecting SQL Server Execution Plans, Grant Fritchey. Link.
