
I am releasing a solution that I have worked on for on-and-off for many years for many different customers. The solution is combination of the feedback and the requirements collected over many years.
One spot to see the over on all health of the SQL Server infrastructure. Make this part of morning DBA Top 5 tasks. Don’t guess the database sizes & disk space. Get understanding of the capacity planning needs or the unexpected database growth. Or just answer the question which Application has the biggest footprint in the SQL Server infrastructure. Last but not least, single stop to found of who has access to your ENTIRE environment from single location.

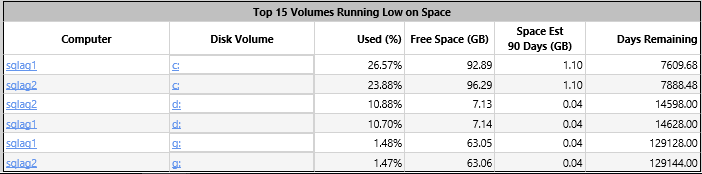
The SQL Server Operational Dashboard (SQLOpDB) provides currents state of the SQL Server infrastructure. The landing page (above) provides health of all services, number of instances returning errors, current health of databases, configuration health as per Microsoft Best practices, SQL Job health, and last but not least unexpected database growth (missing in graph). Example of some of the reports below:


There are 32 reports that help you get insight into your environment. Interested? Get the solution from GitHub. I’ll be explaining the internals of the solution and how to deploy it over the coming weeks. Keep an eye on the SQLOpDB tag.
