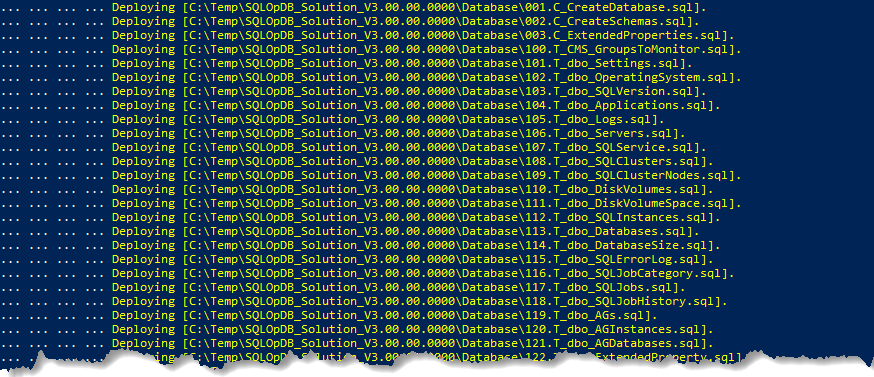
I have tried to automate parts of the deployment. When deploying the current version, there is no way to upgrade from an existing deployment. In later posts I will talk about how you can use Microsoft Data Tools to do a compare and update.
To start, download the deployment package from GitHub.

Only download SQLOpDB_Solution_V3.00.00.0000_RTM.zip. All the source code is part of the zip.
Extract the zip file to C:\Temp\ (or another directory). Once extracted, there should be two files. Run the DeploySQLOpSolution.PS1 with the parameters as below.

| Parameter Name | Required | Description |
| ServerInstance | Yes | The target SQL Server instance (e.g., SQLCMS or SQLContoslo\SQL1). The target instance will host the CMS Configuration, SQLOpDB, Report Logo and SQL Server policies for health configuration. |
| ComputerName | Yes | The target where the PowerShell scripts and the Windows Task jobs will be created. The current deployment script needs them to be same, however can sperate them in manually. |
| DeploymentLocation | Yes | The location for the SQLOpDB reports, notes, and PowerShell files to be deployed. |
| WorkingDirectory | Yes | The location where SQLOpDB_Solution_V3.00.00.0000.zip will be extracted. |
| ReportLogo | No | The report logo is pulled from database and defaults to “SQL Canada”. If you wish to change to your company logo, you can specify the file. The file should be accessible from SQL Engine running on ServerInstance. |
| ReportLogoFileType | No | Defaults to png. The supported format for SSRS Report are png, jpeg, gif, or bmp. |

First step, the deployment script will extract all the files to working directory and setup the deployment directory.
Second step, after extracting the SQL Server policies, it asks you to deploy them. If you are not sure how to deploy SQL Policies reach out, please. SQL Server policies are not optional. The dashboard will be incomplete without them. You do not have to deploy all but deploy the ones that are important to you.

Third step, the database deployment, PowerShell Script deployment, and configuration updates. If an existing deployment (SQLOpsDB) exists, it will not change or attempt a deployment.
If you do not have a database, it will first ask to configure the CMS Server.

If already configured, you can skip this part. If not, it will deploy CMS with “my standard” configuration, like below. No right or wrong way to do it. Only requirement is do not duplicate objects. That is do not put AG Listener in same group as AG replicas (don’t want to assess the same server twice and duplicate data).

After CMS is deployed, next it will walkthrough rest of the scripts to deploy the SQL Server database and all its components.

Forth step, deploy Scheduled Tasks job. This step creates the shell for tasks jobs. However, schedule and login credentials still need to be configured, for the login credentials I recommend using gMSA (you can a Windows service account also). If not sure how-to setup gMSA for Windows Task scheduler. I will post about it in a later post.

There are three task scheduler jobs deployed by default. Please note each job recommends a schedule based on my experience.
| Task Scheduler Job | Recommended Schedule | Description |
| SQLOpsDB.ConfigurationHealth.Daily | Daily 2 AM | This task is evaluating all the target SQL Server instances for best practices defined in SQL Server policies under Maintenance category. Policies that fall into daily categories are such as backup checks, dbcc checkdb checks, etc. Typical run time for about 300 instances about 45 minutes. |
| SQLOpsDB.ConfigurationHealth.Weekly | Weekly Every Sunday 4 AM | This task is evaluating all the target SQL Server instances against all policies defined in Database Configuration, Security, and Server Configuration. On typical server these should not change frequently. Typical run time for about 300 instances is unknown (please give me a baseline :D). |
| SQLOpsDB.DataCollection | Daily 6 AM | This is primary job that collects all the metrics daily and store it in SQLOpDB database on ServerInstance. Typical run time for about 300 instances is 3 hours. I hope to make this multithreaded in future to lower his number. |
It is important for the ConfigurationHealth jobs to finish before DataCollection, to allow the DataCollection job to create snapshot for the landing page. So, adjust schedules as per your server’s performance.
Fifth step, after jobs are created. The deployment script will copy all the report files with Visual Studio solution to Deployment Directory.

I did not automate the deployment of reports. As I suspect people might want to modify these reports. Therefore, I am providing the full solution. Using Visual Studio 2019 with SSRS extension. Deploy these to your report server. Before deployment update the connection string and SSRS deploy server. Not sure how? Reach out.
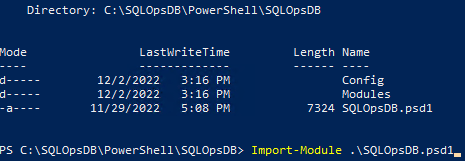
Sixth step, the solution deployment completed. Yeeeh! But before running collection, the solution must be told what to monitor. Navigate to where SQLOpDB module is deployed and import the module.

After deployment, execute the following command-let (there are 72 command-lets in the module, I will describe them in later posts).

Get-SQLOpCMSGroups, provides list of all the CMS groups discovered and their current monitor state. Select the groups to monitor the GroupID or Name and enable each group for monitoring. Again, reminder DO NOT monitor AG Listeners.

Seventh step, last step (almost) before solution can be executed. Execute the following command to review the default settings. I will explain these settings in later post also.

Update the Default_DomainName setting. If you have multiple domains, specify the value for most common. I will explain how solution handles multiple domains in later post.

Eighth step, this is absolute final step. However, it is also important. Without the solution will not complete any collection. The collection solution relies on extended properties defined on the master database for each instance. Some of these extended values I can pull from SQL Server instance directly, in time I hope to migrate them. For now these are needed for collection. Below is an example.

| Extended Property Name | Required | Expected Values | Description |
| ActiveNode | Yes | Server Name | The current instance’s server name only. |
| EnvironmentType | Yes | Prod, Test, UAT, Dev, etc. | No way to collect this, so please label what environment the instance belongs to. If multiple environments are deployed, identify has the highest severity. |
| MachineType | Yes | Virtual or Physical | Type of physical hardware for server. |
| ServerType | Yes | Stand Alone, AlwaysOn Availability Group, Microsoft Clustering, or Veritas Clustering. | Use the classify the server and in some cases to do specialized checks. |
| PassiveNode## | Depends | Server Name | This value does not identify really identify current active or passive nodes. Just all the other nodes in the topology for AG, FCI, or Veritas Clustering. Replace the ## with 01 to 08. (Max the solution will scan is up to 8-nodes). |
These values can be updated via PowerShell or T-SQL script. PowerShell example is below:

With this the solution is fully deployed, update the schedule tasks login and scheduled time. Execute and start leveraging the SQLOpDB to make your teams life a bit easier.
