SQLOpsDB Dashboard is primary report where all investigation starts for data collection. The database dataset is generated at the end of execution of the SQLOpsDB_DataCollection.ps1 PowerShell script.
If for some reason the dashboard is returning blank, it means the data collection script did not complete. Review the SQLOpDB Data Collection Logs to understand where it is stuck.
The dashboard is broken up into three sections.
First, health overview.

- SQL Services Overview: Return list of all services that are set to “Automatic” as start-up property. If the service is set to “manual” or “disabled” they are not counted or evaluated.
- SQL Errors Overview: Count of SQL instances that are return errors. The solution does not collect the full error long. Only the error messages and some key messages are captured. Will explain this in later reports.
- Database Overview: Returns all the databases and their current state. If there are databases in non-health state (i.e., not online) and that is their expected or desired state. You can exclude those data bases from report by adding an entry in dbo.Databases_Exclusions.
- SQL Configuration Health: This data is summarized from the EPM collection scripts.
- SQL Job Overview: All jobs that have completed, failed, or cancelled in last day. It does not provide full list of jobs. But rather their last state.
- Large Database Size Change: Calculates the full growth of databases per instance and evaluates to last day. Identifies any instances that have had more then 5GB change in a single day. The change can be positive or negative.
Each graph provides drill through functionality, to explore data elements that make up the graph.
Second, disk that might be running of the space soon.

This tries to calculate the expected number of days until a volume might run out of disk space. “It might,” because the calculation is based on daily change. If your team has liner growth it will be fairly accurate. However, if you have unexpected growth or continuous shrink operations, it might not give the best estimate. INF means the volume will never run out of space as it is based on current trends.
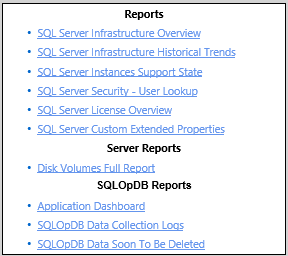
Last, additional reports to explore the infrastructure.

I’ll be explaining these reports in later posts.
